4.1Plankton slide sample testing
In order to test the performance of the system, the sample slide of paramecium is used. After taking the background image (which follows the same process but without the slide on), there are several steps to follow:
- Fix the slide on the slide holder, and connect the camera to the receiver device.
- Adjust the height of the slide holder to minimize the distance between the slide and the CMOS.
- Open one of the RGB LEDs or turn the filter plate to one of the RGB filters.
- Record the picture in the receiver (computer or MCU).
- Repeat steps 3 and 4 to take pictures under all the lights.
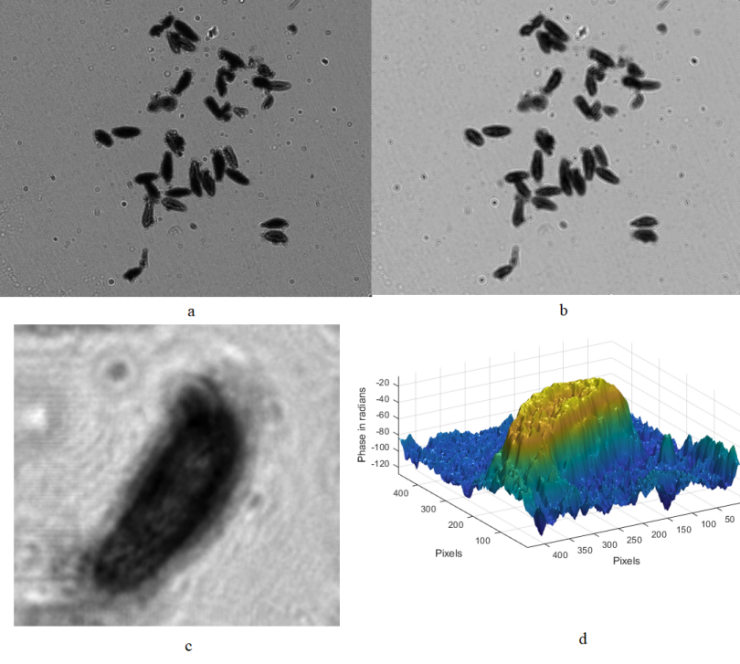
After taking the photo, three background images and three object images are processed as in Figure 4. The image before and after processing is shown in Figure 7.
Figure 10a provides the original image taken under green light of 525μm. As shown in Figure 10b, the clarity of the image greatly improved. Figure 7c shows the processed image of one specific paramecium. The 3D shape of one specific paramecium can be derived as shown in Figure 7d.
4.2Water quality sample collection
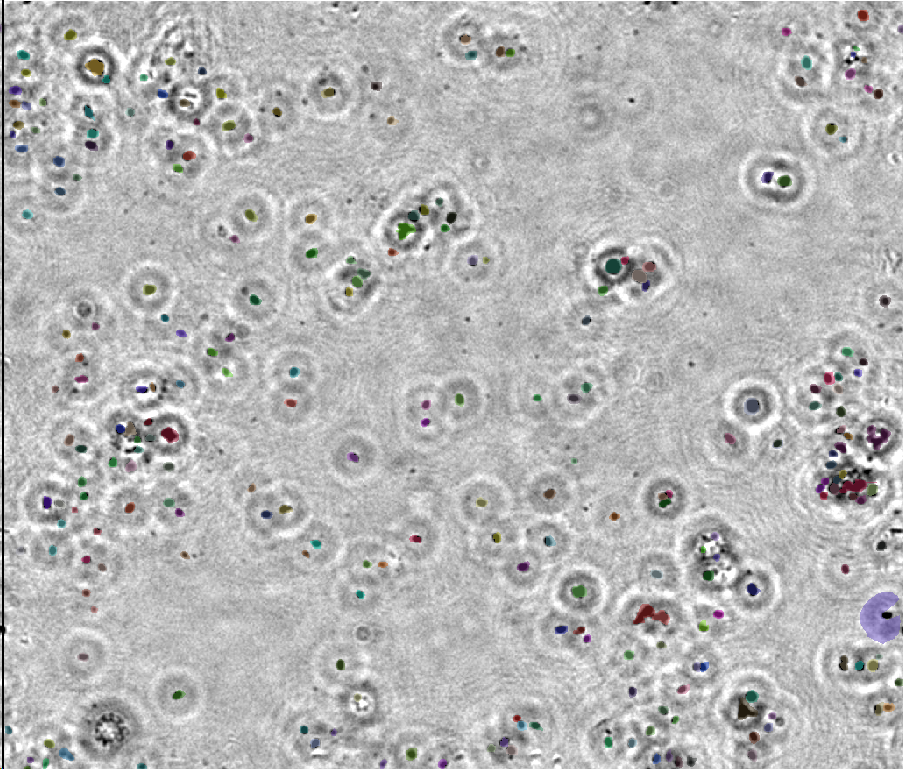
After making the concentrated water sample slide using the process illustrated in section 2.3, the sample can be recorded using the process illustrated in 4.1. The number of cells in the processed image can be calculated using level-set based cell image segmentation.
Level-set based cell image segmentation is an advanced image processing method for recognizing and segmenting cells from complex backgrounds. This technique is very important in biomedical imaging analysis, especially in cases where individual cells need to be accurately identified and quantified. The following is the basic process of level set based cell segmentation technique:
- Image Acquisition and Preprocessing: after processing to obtain images of the observed microorganisms, the images need to be pre-processed. This includes steps such as denoising, contrast adjustment, grayscaling etc.
- Level Set Function: The level set method relies on a mathematical representation called the level set function, which is used to define the foreground (e.g., cells) and background in the image. The level set function is evolved through a mathematical formulation (usually a partial differential equation). This process causes the contours of the level set to gradually move towards the cell boundaries.
- Segmenting the Cell: When the level set function is stable, i.e., the contour no longer changes significantly, it is considered to be close to or at the actual boundary of the cell. At this point, this contour can be used to segment out the cells in the image.
- Post-processing: The segmented result may require some post-processing, such as removing regions that are too small (which may be noise), or merging regions that are very close together (which may be different parts of the same cell).
The number of cells calculated by the above method is only the number of cells inside the view of the CMOS. In order to estimate the complete number of cells on the slide , the ratio of the CMOS area and slide area is used for estimation with the formula ${n_t} = {n_c}*{S_s}/{S_c}$
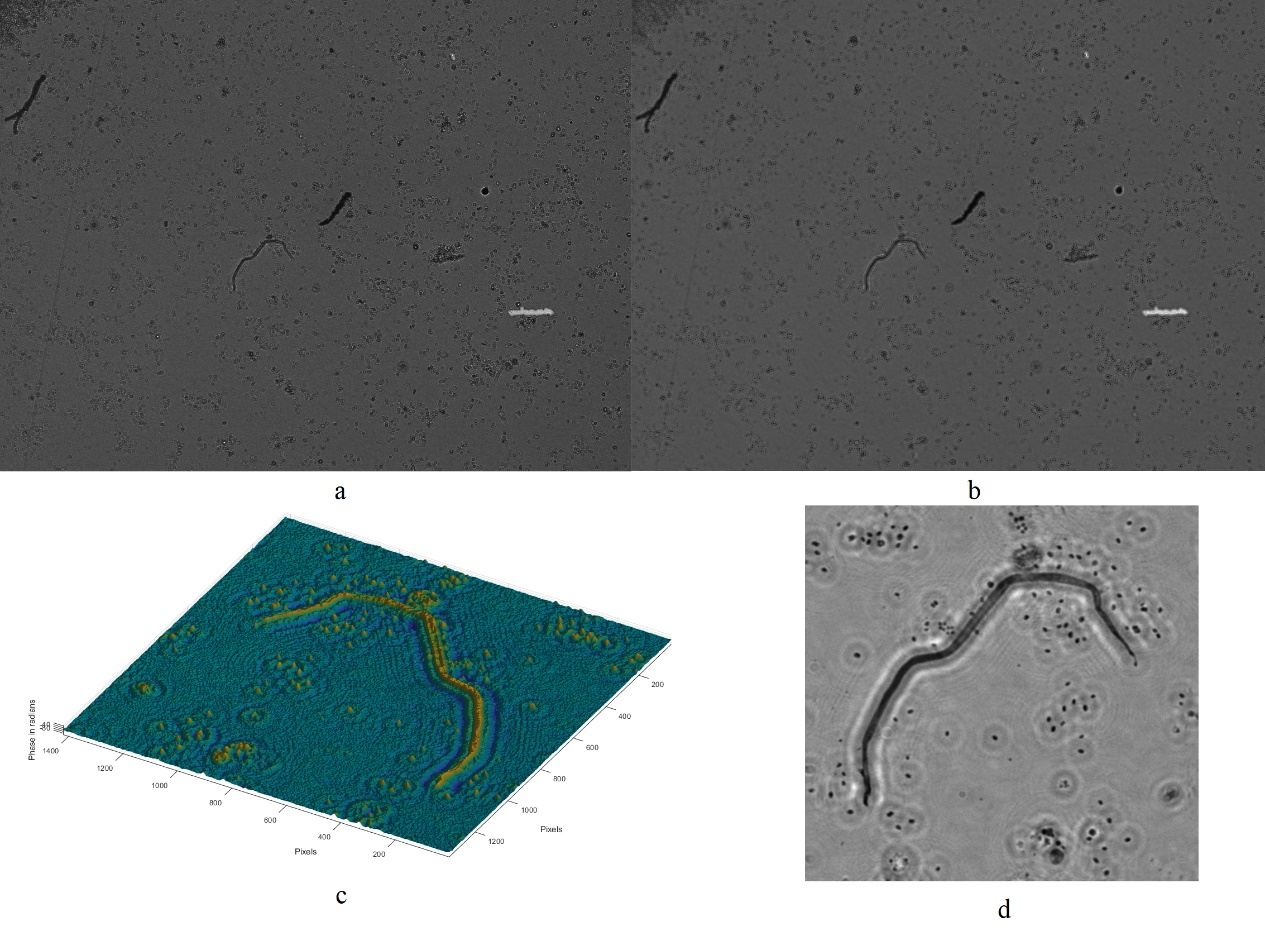
In Figure 9, the water sample from a pond in the Princeton area is processed using the above procedure. Figure 9a shows the original image of the concentrated water sample, and Figure 9b is the image after phase retrieval. Figure 9d shows the phase retrieved image of a small part of the image, and Figure 9c shows the 3d shape of the image.
4.3 Overall analysis
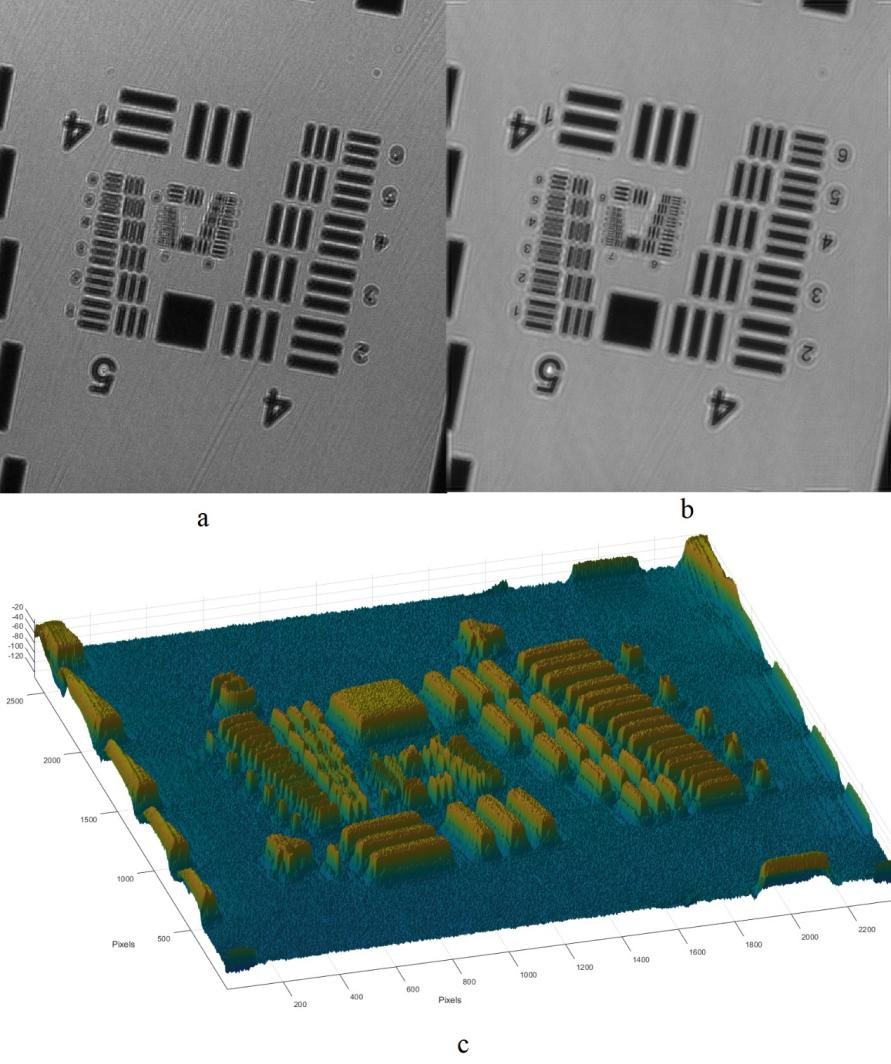
In order to get a more systematic evaluation of the system, the USAF1951 resolution board is used. As shown in Figure 10, Figure 10a is the original image under green light of 525μm, and Figure 10b is the processed image. The system can capture at most group 7 element 5 clearly, which is 2.46μm. In this test case, the CMOS we tested has a pixel size of 2.2μm by 2.2μm, so the system is approaching the theory limit resolution of the hardware.